添加趋势线和添加一个数据系列非常相似。C1Chart将自动基于数值计算并绘制趋势。默认情况下,趋势线将有一个多项式FitType,其Order属性的值为2。下面的代码演示如何添加趋势线:
| Visual Basic |
拷贝代码
|
|---|---|
'add trend line Dim tl As New TrendLine() tl.Label = "Trendline" tl.ConnectionStroke = New SolidColorBrush(Colors.Red) tl.XValuesSource = myXValues tl.ValuesSource = myValues chart.Data.Children.Add(tl) |
|
| C# |
拷贝代码
|
|---|---|
//添加趋势线 TrendLine tl = new TrendLine(); tl.Label = "Trendline"; tl.ConnectionStroke = new SolidColorBrush(Colors.Red); tl.XValuesSource = myXValues; tl.ValuesSource = myValues; chart.Data.Children.Add(tl); |
|
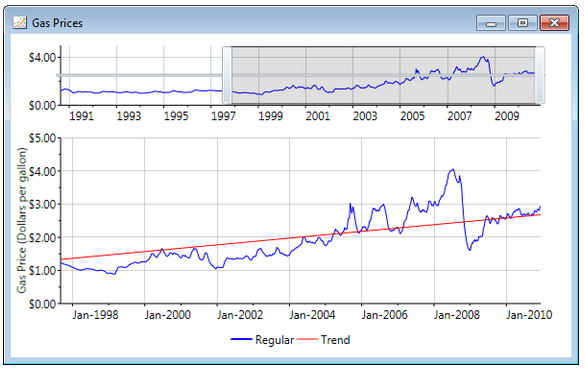
你可以看到下面的图像,默认的趋势线没有紧密地靠近数据:

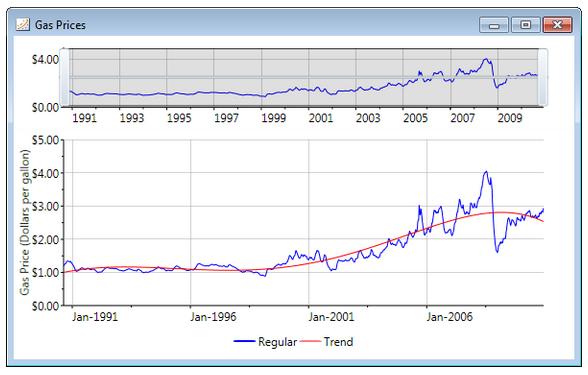
你可以通过改变Order属性来获得更好的拟合。您可以指定FitType以及Order属性以获取您所期望的拟合结果:
| C# |
拷贝代码
|
|---|---|
TrendLine tl = new TrendLine(); tl.Label = "Trend"; tl.FitType = FitType.Polynom; tl.Order = 6; |
|

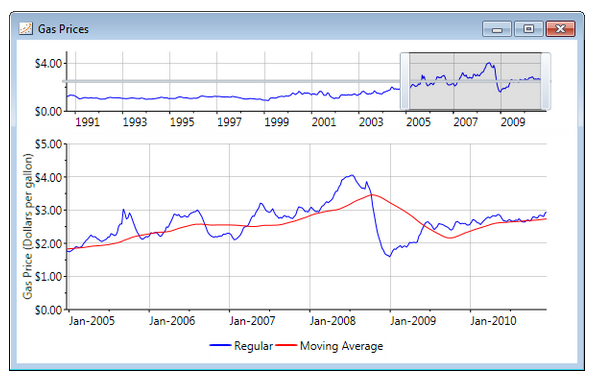
图中的图表使用的数据展示了汽油的价格,这些值每七天获取一次。对于这一类数据,使用MovingAverage趋势线是比较合适的。在下图中你可以看到它是如何拟合数据的:

当建立一个移动平均趋势线,你必须实例化一个新的MovingAverage对象并设置Period属性。此属性指定用于趋势线的数据点的个数。由于天然气价格每七天计算一次平均值,每年48个平均值:
| C# |
拷贝代码
|
|---|---|
MovingAverage ma = new MovingAverage(); ma.Label = "Moving Average"; ma.Period = 48; ma.XValuesSource = days; ma.ValuesSource = price; ma.ConnectionStroke = new SolidColorBrush(Colors.Red); chart.Data.Children.Add(ma); |
|
查看其它